conkw documentation - My very own setup
Here is my current setup:
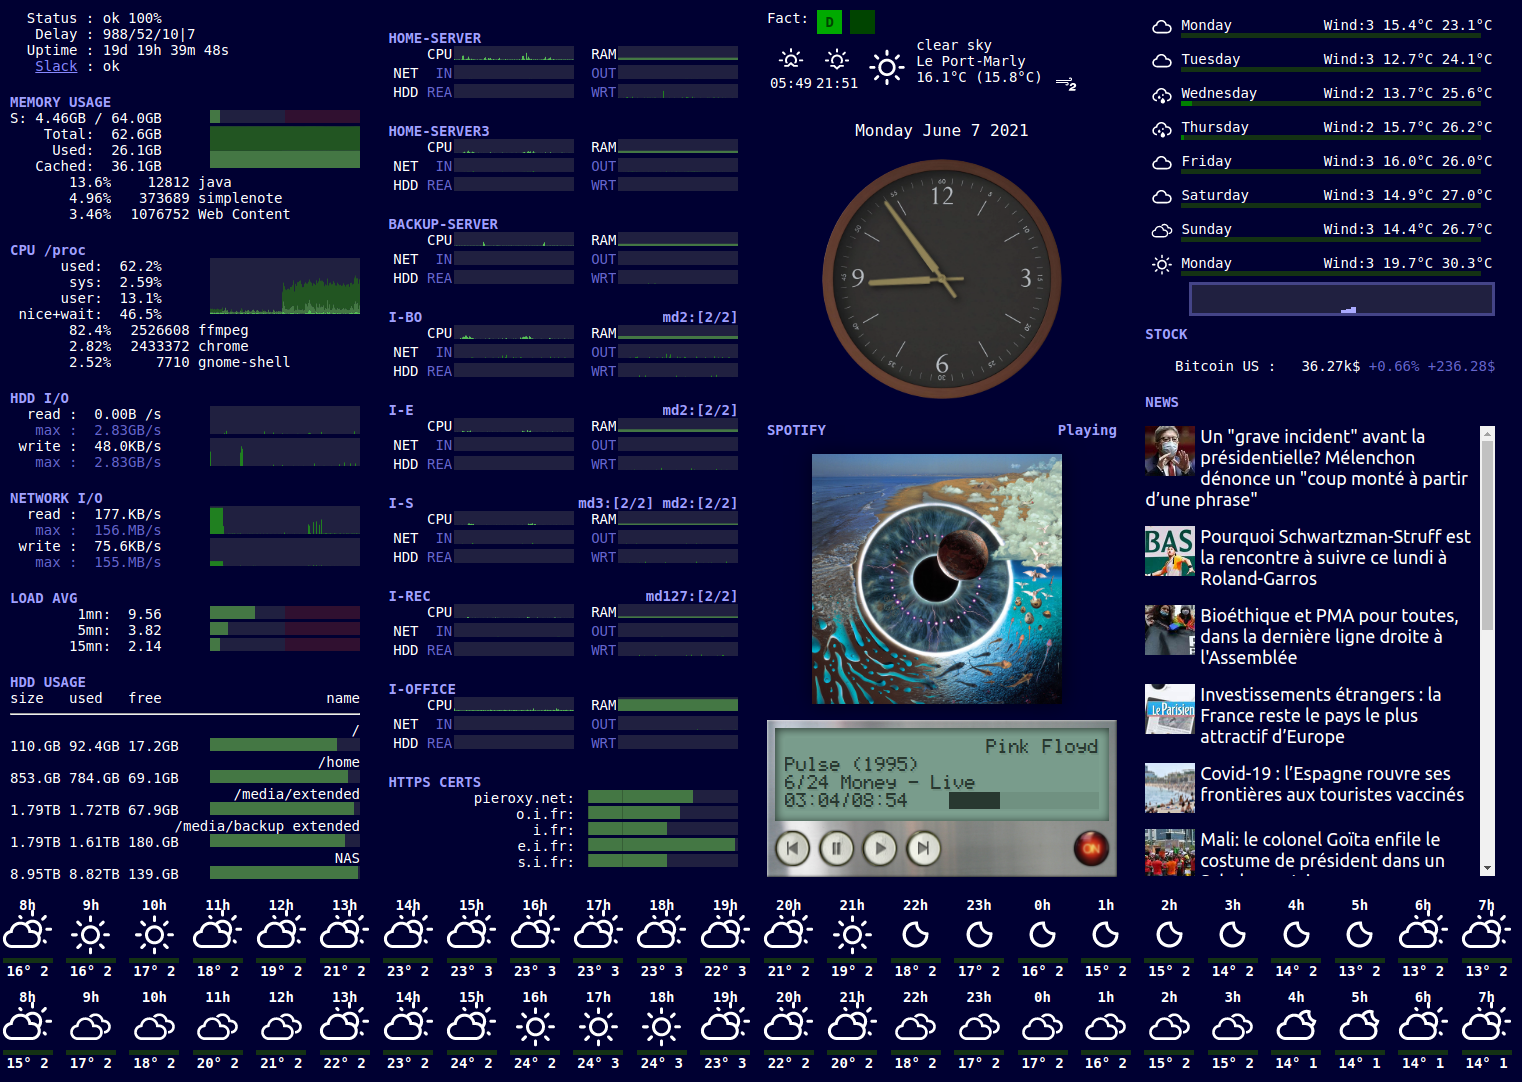
Explanations of the regions
- The first column represents my main computer on which I am working all day long. CPU, RAM, network, hdd, etc.
- The second column represents all other computers and services I own or operate. Servers in the basement, hosted servers, etc. It goes from production beasts to raspberry pies.
- The third column represents the time and music, plus today's weather.
- The fourth column id the 8 day weather forecast, along with stock and news.
- The bottom portion is the 48-hours weather forecast.
Detailed explanation
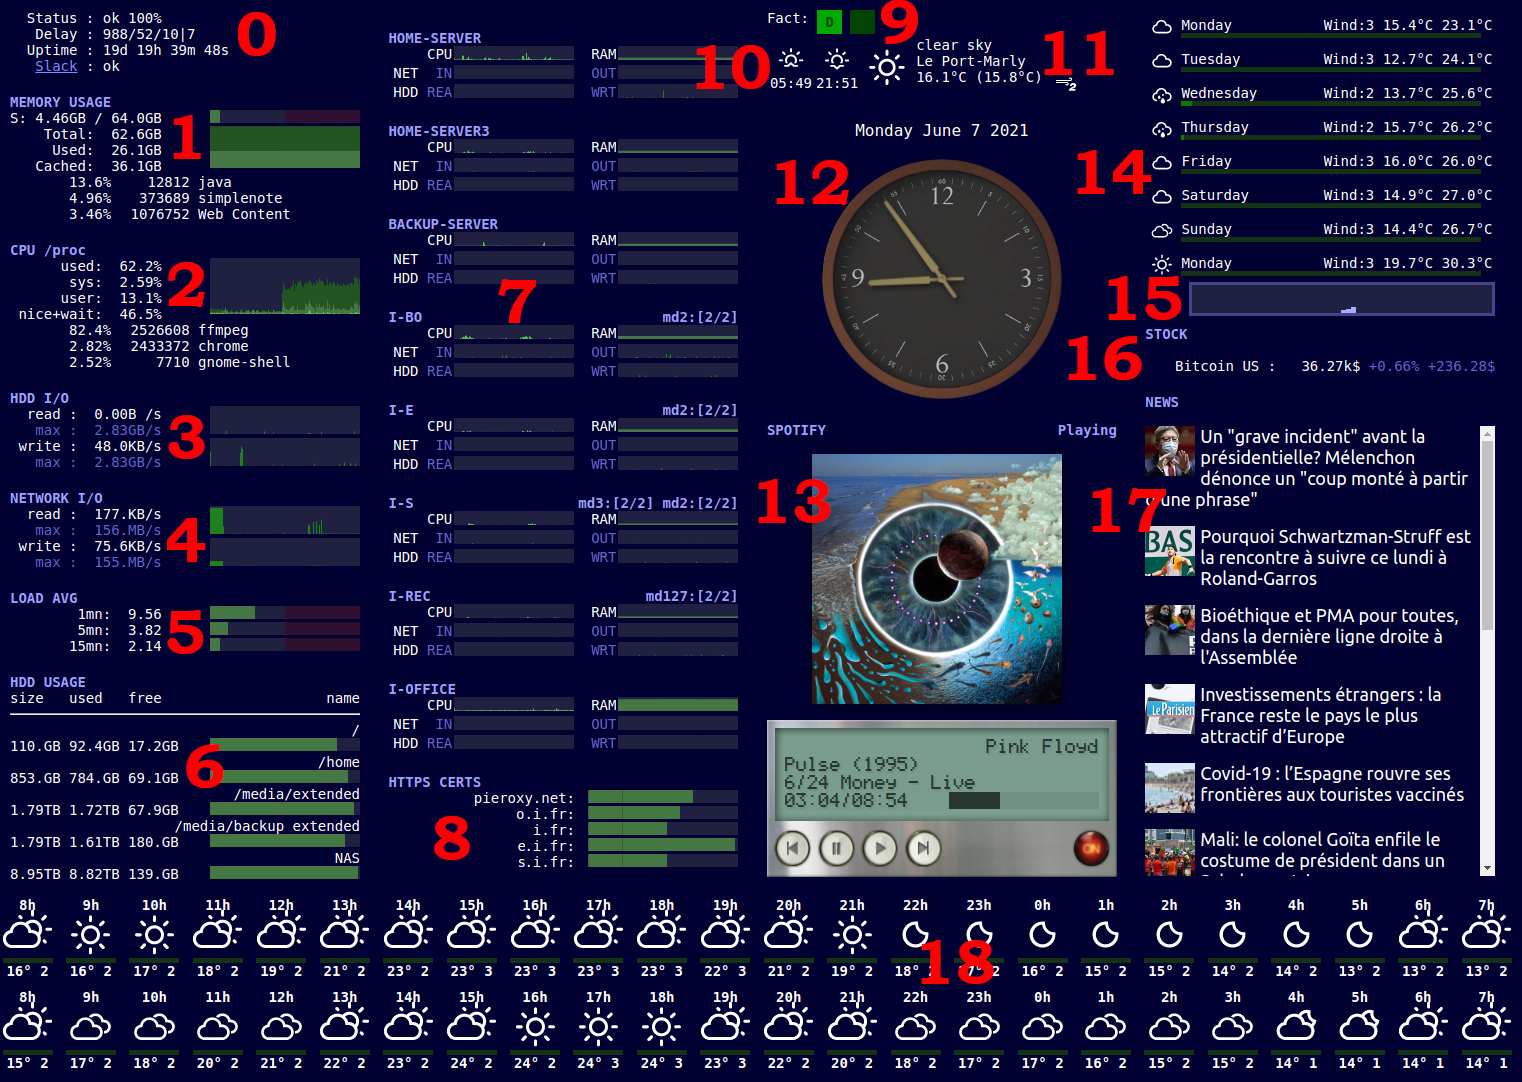
0 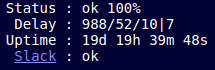
- The first line represents the global conkw status and the zoom level of the UI.
- The second line various metrics about conkw performance.
- The third the uptime of my computer
- The fourth the status of the online Slack service. See the FileGrabber to see how I do it.
1 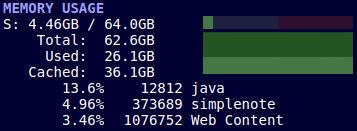
This is the RAM usage of my machine.
- The first line is the swap used, with a gauge.
- The second one is the total amount of memory.
- The third the used memory
- The fourth the cached memory
- All three lines above are represented into a hgauge. That's a gauge with history.
- The bottom part represents the top 3 processes as far as RAM usage is concerned. IntelliJ is on top :)
2 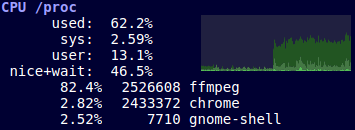
This is the CPU usage on my system.
- The first line is the CPU used, total
- Then the cpu used by the system (sometimes called kernel time)
- The cpu used by user processes
- The cpu used by niced and wait processes
- All four values are summarized on an hgaughe. As you can see, there is a huge increase in CPU usage over the last minute.
- Then, you see the top three processes, from a CPU usage standpoint. As you can see most of the CPU is used by ffmpeg.
3 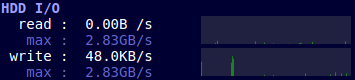
This is the HDD I/O, summarized.
- Read rate in the last second
- Maximum read rate observed since the conkw installation
- This is summarized by an hgauge. As you can see, not much activity in the last minute.
- The second portion is the same about writes. As you can see there was a burst a bit ago.
4 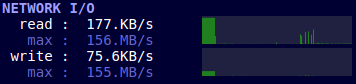
This is the Network I/O, summarized.
- Input rate in the last second
- Maximum input rate observed since the conkw installation
- This is summarized by an hgauge. As you can see, there was a huge read activity about two minutes ago.
- The second portion is the same about output. The huge read burst happened while a small output burst was happening. This is always the case with network.
5 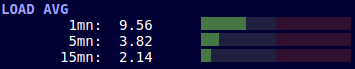
The load average on my system, over the last minute, 5 minutes and 15 minutes.
6 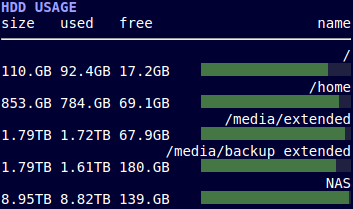
The HDD usage percentage. This is all the mount points on my system, so not only local filesystems can be monitored. As usual, my NAS is almost full.
7 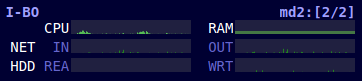
External computers monitoring
This section includes monitoring for 8 different computers. You can see 6 hgauges for each machine:
- CPU
- RAM
- NET in/out
- HDD Read/writes
Is also monitored the state of the mdadm arrays on the machines that have them. That's software raid, in case you don't know. You can see a "summary string" for the arrays. If it ever deviates from this value, il will be displayed in red.
8 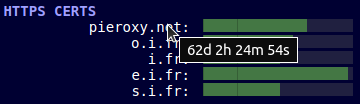
This section monitors all of the https certs I am handling. It expresses the number of days of validity. Gets red below 20 days. Those https certs are renewed by themselves, but you gotta monitor this process.
9 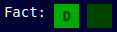
My billing section. The green square shows which custromer I am currently billing. Here, I am billing customer "D". As I am a contractor, I have to keep track of this. I wrote a small tool to do this, but I consistently forgot to open or close my billing. This way I have the data right in front of my eyes. That's the whole point of a monitoring board.
10 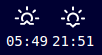
This portion shows the sunrise and sunset time for the current day.
11 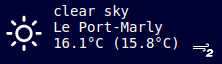
This one shows the current weather at my place:
- The picture
- The description of the weather
- The location of the weather I'm looking at
- The temperature (and felt temperature)
- The wind speed in beaufort scale.
12 
The clock showing time and the date above.
13 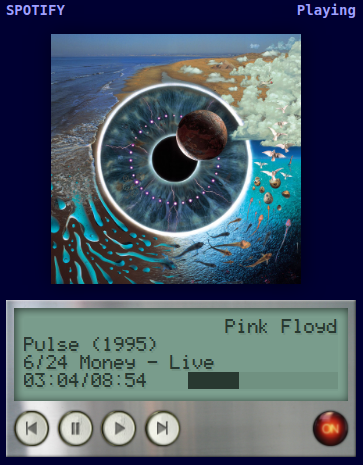
The current playing song with the default conkw UI. See the SpotifyGrabber to see more.
14 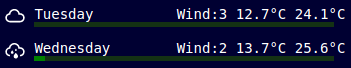
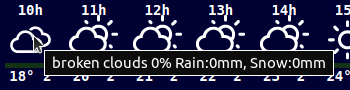
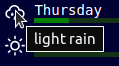
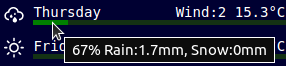
This one shows the weather forecast for the next 7 days.
For each day I have:
- The picture
- The day
- The wind in beaufort scale
- The min temp
- The max temp
- The amount of rain forecast (The green gauge - my own computation)
- Additional info in tooltips:
15 
This histogram represents the amount of rain (again, my own computation) over the next hour, minute by minute.
16 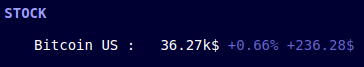
The stock market. I only monitor bitcoin for now. Have a look at the YahooFinanceGrabber to see more.
17 
The news. I show global headlines for France in here. Have a look at the BingNewsGrabber to see more.
18 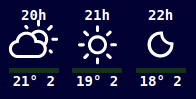
This is the weather forecast hour by hour over the next 48 hours.
- The time
- The picture
- The temperature
- The wind in beaufort scale.
- Again, tooltips show more details.